
This is a second analysis comparing the performance of two Garmin GPS receivers, an etrex Vista and an etrex Vista HCx. We attempt to show a side-by-side comparison of the two units' readings, using both screenshots of the satellite view and the recorded coordinate data.
During the readings, the units were kept stationary, next to each other, and with the same orientation (with the screen facing upwards). The sky was not obstructed by buildings but the units were located near the base of a medium-sized tree in order to test reception under suboptimal conditions. It is expected that the tree will absorb some of the incoming GPS signals but probably not reflect them. So the effect should be to attenuate the signals rather than to produce misleading, false signals. This is of course rather difficult to confirm.
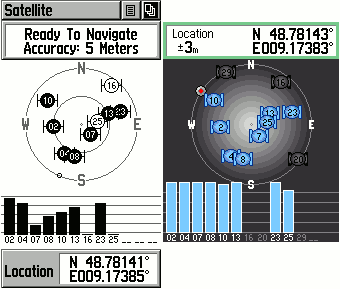
In order to analyse the receivers' view of the satellites, it was necessary to take screenshots from the receivers as the stored tracklogs do not contain information about the satellites. The unit displays on the other hand show the positions of each satellite, the strength of the signal, and the calculated coordinates and estimated accuracies, as can be seen in the screenshot below. Immediately, several differences between the two receivers can be observed.
 Screenshot of satellite view from both units, Vista on left, Vista HCx on right |
Cosmetically, the main obvious difference is that the older unit only has a greyscale LCD screen, and has a greater number of pixels than the newer HCx unit with its colour TFT display. However, the information presented is largely the same. The satellites can be seen at approximately the same positions in the sky, and are shown with the same numbers. There is a small discrepancy with the marked position of satellite number 13 on these pictures though.
The signal strengths have no scale associated with them so it is difficult to compare them, but it can be seen that the HCx has obtained a strong signal from satellite number 25, whereas the older Vista has not got a signal at all. Also the Vista has a very weak signal from satellite number 7, whereas the Vista HCx has a full-strength signal. Both these satellites are near the zenith, which is where our tree is doing most of its obscuring. So it does appear that the Vista HCx can overcome this signal attenuation with its higher sensitivity receiver.
The measured coordinates from the two units are in very close agreement (roughly 3 metres apart), and the estimated accuracies (+/- 5 metres, +/- 3 metres) are also very similar. It can be seen that the geometry of the observed satellites is very favourable (with wide angular separation) so a good accuracy in position can be expected. However both units have been observed to be rather optimistic about their estimated accuracies, as can be seen by retracing a previously traced route.
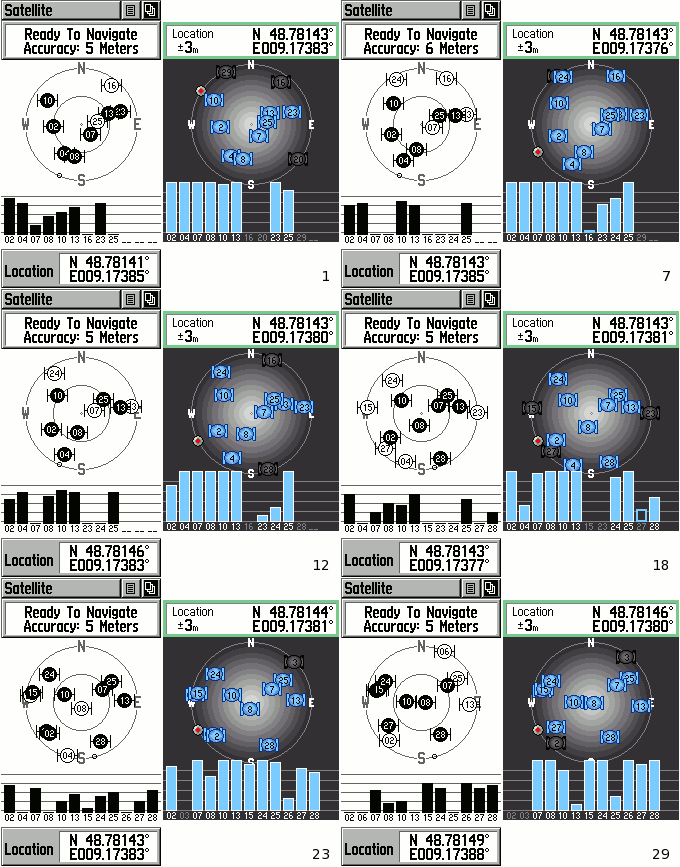
It is interesting to see how the motion of the satellites can be tracked using these screenshots. We already know that the GPS satellites are not geostationary, so they should move across the sky as we watch them. But do they all move in the same orbits, so they all move either north or south? It's easy to check this by recording screenshots at regular intervals and observing the motion of the markers. An animated (speeded-up) view is shown below. Each frame represents 4 minutes of elapsed time.
 Animation of the satellite views from both units, Vista on left, Vista HCx on right |
It appears that the satellites move in all directions, and don't conform to any north-south pattern. Due to the relative motion there is not a constant number of satellites in view but gaps open and close, and the satellites bunch together and separate again. Under poor visibility conditions, it is quite possible that all the satellites move into obstructed parts of the sky, and the signal is lost, but a short time later the pattern changes such that a signal can be received again.
According to Wikipedia, the GPS satellites are actually arranged in 6 orbital planes, all inclined at around 55° from the equator. This gives a total of 24 satellites, plus spares, which could explain why the screens show numbers from 2 to 29. In total, 17 different satellite numbers can be seen in this 2 hour window, although many of them do not climb high enough above the horizon for a good signal lock.
The orbital period for the satellites is supposed to be half a sidereal day, which means in our 2 hours each satellite should complete around one sixth of an orbit. Confirming this with these screenshots is not possible, however.
From this animation, it appears that the satellites are uniformly spread over the sky hemisphere. However it can be shown that if all the GPS satellites have inclination angles of 55°, none of them can approach closer than 35° to the north pole. This subject is covered in greater detail in the satellite motion page.
Using the screenshots we can simply count how many satellites are seen by each receiver, to compare the sensitivity under partial tree cover. Here we see that the old Vista received on average 6.8 satellites, and the newer Vista HCx received on average 9.3 satellites. The newer receiver always received more satellites than the older receiver, on occasion up to 5 more, and usually 2 or 3 more. The older unit received between 5 and 9 satellites, and the newer unit received between 8 and 11 satellites.
As an additional test, roughly half-way through this experiment (at frame 16 on the above animation), the older Vista was switched from "Battery saver" mode to "Normal" mode. Under normal operation the only usable mode is "Battery saver", as otherwise the batteries don't last a full day hike, but I was under the impression that the "Normal" mode boosted the signal sensitivity to improve reception under cover. However, at least here, switching the mode made absolutely no discernable difference whatsoever.
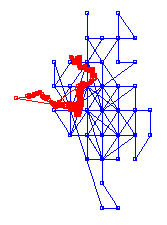
 Tracks from both units Vista in blue, Vista HCx in red |
By recording tracks with both units, we can compare the outputs and see a very similar result to those from the receiver precision analysis. The blue track from the older Vista is again scattered much more than the red one from the newer Vista HCx and again shows the discretisation effect seen earlier.
Of course the data can be averaged, and doing this for each receiver gives points within just 3 metres apart. It would perhaps be interesting to perform a weighted average of the points instead, using the number of satellites used for the fix as a weighting factor. However in our example we have many more points than screenshots, so we would have to approximate the weighting factors for all the points in the time interval. Plus for each receiver the variation in number of satellites is not very great, so the effect of the weighting would be minimal in this case.
A better way to perform this kind of 'smart' averaging would make use of the NMEA messages from the receiver, which contain much more information than that stored in the track log. These NMEA messages contain not just the number of satellites but other accuracy information such as horizontal dilution of precision and fix quality. Strangely however it seems that the newer Vista HCx is incapable of outputting the NMEA messages, only the older unit can be put into such a mode. With a source of NMEA messages, the messages themselves can be logged by simple tools like minicom and then processed later, or they can be parsed by (for example) the gpsd daemon and fed to other programs.
It has been possible to show that the newer etrex Vista HCx is indeed able to lock on to the signals from more satellites than the older etrex Vista. Due to the tree obstruction, satellites near the zenith were blocked for the older Vista but could still be received by the newer HCx. Similarly, the HCx was able to lock onto satellites closer to the horizon than the Vista. Switching to "Normal" mode on the older Vista had no noticeable effect on the reception.
Despite the completely regular orbits of the satellites, the motion as seen from the receiver appears chaotic, with markers travelling in all directions and distributions becoming more bunched and more spread out over time. Therefore it's possible for signal to be lost in poor visibility conditions but at exactly the same place the satellites may conspire later to give sufficient reception. It's not trivial to estimate which way a given satellite will move or how long you will have to wait for a favourable pattern to develop.